What is a Data Pipeline? Architecture, Tools, and AI-Driven Automation
By
Samara Garcia
•

Picture a fast-growing Series A SaaS startup in 2026. Teams want real-time analytics and AI-powered features, but data is scattered across tools and databases. Every decision turns into Slack threads, CSV exports, and manual spreadsheets.
This is the cost of weak data pipelines. Data pipelines move information reliably from source systems to analytics, dashboards, and AI models, powering everything from recommendations to fraud detection.
In this guide, we cover what data pipelines are, how they work, the tools behind them, and how to hire the right engineers to build and scale your data infrastructure.
Key Takeaways
Modern data pipelines move data from sources through ingestion, processing, storage, and analytics, using tools like Kafka, Snowflake, and dbt.
AI automates tasks like data quality checks, anomaly detection, and schema mapping, cutting manual work by up to 70%.
Pipelines vary by use case: batch for scheduled jobs, streaming for real-time data, and hybrid for flexibility.
They power core functions such as real-time analytics, fraud detection, recommendations, and BI dashboards.
Fonzi AI helps teams hire top AI, ML, and data engineers to build these pipelines, often within a 3-week Match Day cycle.
What Is a Data Pipeline? Core Concept and Real-World Examples
A data pipeline is fundamentally different from ad-hoc scripts and manual exports. While you could export CSVs from Stripe to Google Sheets every morning, that approach breaks the moment you’re sick, on vacation, or processing more than a few hundred records. Data pipelines provide reliability, repeatability, and monitoring, automatically moving and transforming data without human intervention.
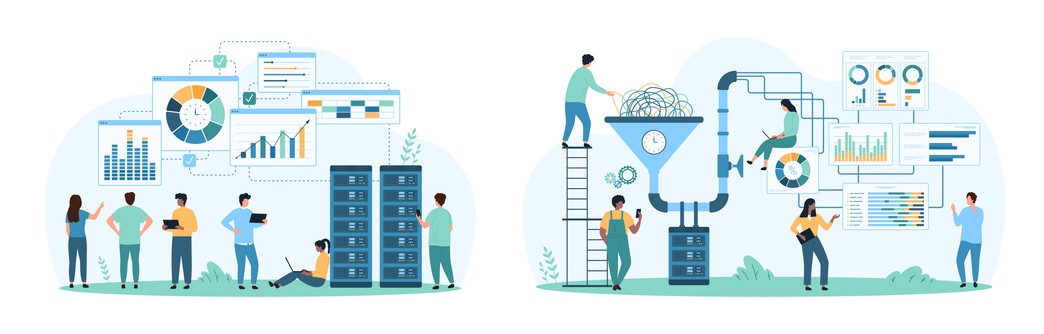
The “water pipeline” analogy is useful but limited. Yes, data flows from one place to another. But modern data pipelines are more sophisticated: they’re automated flows that handle data ingestion, data transformation, validation, and delivery across complex data workflows.
Here are concrete startup-grade examples:
Product analytics pipeline: Event data from Segment or Snowplow flows into Snowflake, gets modeled in dbt to create user cohorts and engagement metrics, then powers dashboards in Mode or Looker.
E-commerce recommendation engine: Orders and browsing behavior stream via Kafka into a feature store, feeding real-time data to ML models that personalize product recommendations for each visitor.
Financial fraud detection: Transaction events stream into a processing system built on Spark or Flink, where ML models score risk in milliseconds and trigger alerts for suspicious activity.
Marketing attribution: Data from multiple sources, ad platforms, CRM, and web analytics, gets consolidated nightly to calculate which channels drive conversions.
Data pipelines can be batch (hourly, nightly) or streaming (sub-second to seconds latency). Most modern stacks mix both approaches based on use case requirements.
Well-designed pipelines also capture lineage and metadata, what data moved, when, from where to where. This supports:
Debugging when something breaks downstream
Compliance requirements for regulated industries
Impact analysis when source systems change
Data Pipeline Architecture: From Source to Insight
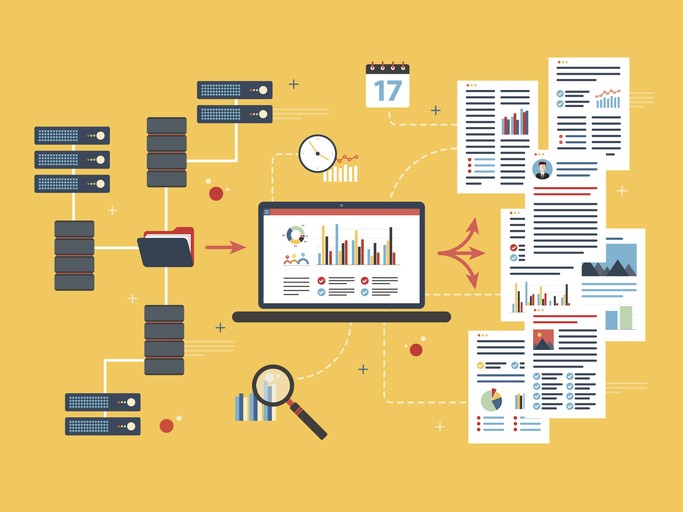
Understanding data pipeline architecture means understanding how each stage connects: sources → ingestion → processing → storage → consumption. Resilient architectures reduce downtime and data incidents. Weak architectures create constant firefighting.
A canonical modern pipeline used by AI-driven startups typically flows from application databases and event streams, through ingestion layers like Kafka or Fivetran, into cloud data warehouses like Snowflake or BigQuery, with transformation handled by dbt, and finally consumed by BI tools, reverse-ETL systems, and ML models.
Strong architecture is what lets companies scale from a few thousand events per day to billions without constant babysitting by the data team.
Data Sources
Typical 2024–2026 data sources include:
Application databases: PostgreSQL, MySQL, MongoDB
Event trackers: Segment, Snowplow, Amplitude
SaaS tools: Salesforce, HubSpot, Stripe, Zendesk
Logs and infrastructure: CloudWatch, application logs
IoT devices: Sensor data, device telemetry
Internal APIs: Microservices, legacy systems
Sources differ by data shape and velocity. Transactional tables have structured and unstructured data with clear schemas. Clickstream events arrive as high-frequency JSON payloads. Unstructured data, like logs and documents, require different handling than clean relational tables.
Common access patterns include:
Direct database reads via JDBC/ODBC connections
Webhooks for real-time event notifications
CDC (Change Data Capture) with tools like Debezium
Vendor APIs with rate limits and pagination requirements
Every team needs a clear source catalog and ownership model. Who owns Salesforce data? Who maintains the application events schema? Without this clarity, you end up with “mystery feeds” in production pipelines that nobody understands or can fix.
Data Ingestion
Data ingestion is how raw data gets moved from sources into a central platform, whether that’s Snowflake, BigQuery, Databricks, or a data lake on S3, GCS, or Azure Blob.
Batch ingestion (e.g., Fivetran or Airbyte syncing data every 15 minutes) works well for data that doesn’t need real-time freshness. Streaming ingestion (e.g., Kafka topics or Kinesis streams) handles millions of events per minute for use cases requiring continuous data ingestion.
Practical ingestion concerns include:
Schema drift: Source systems change columns without warning
Idempotency: Reruns shouldn’t create duplicate records
Backfills: Loading historical data after initial setup
Network reliability: Handling timeouts and retries gracefully
Popular ingestion tools by category:
Managed ELT: Fivetran, Stitch, Hevo
Open-source connectors: Airbyte, Meltano
Message queues: Apache Kafka, AWS Kinesis, Pulsar
CDC platforms: Debezium, Striim
Data Processing and Transformation
Data processing is where raw, noisy data becomes analytics-ready tables or ML features. This stage handles cleaning, deduplication, joins, and business logic application.
Concrete transformations include:
Standardizing time zones to UTC
Mapping country codes to consistent formats
Anonymizing PII for compliance
Computing metrics like LTV, MRR, and churn rates
Building user cohorts for analysis
Core technologies for this stage:
SQL-based transformation: dbt (data build tool) for modular, tested SQL
Distributed computing: Apache Spark, Flink, or Beam for large-scale processing
Python workflows: Custom scripts orchestrated with Airflow or Dagster
Many teams now implement CI/CD for transformations. This means tests, code reviews, and staging environments to prevent breaking dashboards or models. Unit tests validate transformation logic. Data quality checks catch unexpected values before they pollute downstream tables.
Data Storage and Modeling
The difference between a data warehouse and a data lake matters for architecture decisions:
Data warehouse (Snowflake, BigQuery, Redshift): Centralized, structured analytics database optimized for SQL queries. Best for business intelligence and reporting.
Data lake (S3 with Apache Iceberg or Delta Lake): Large, low-cost repository storing raw files in native formats. Best for ML workloads and exploratory data analyses.
Lakehouse approaches: Combine lake storage economics with warehouse-like query capabilities.
Storage design patterns like bronze/silver/gold layers organize data by transformation state:
Bronze: Raw ingestion, exactly as received
Silver: Cleaned, standardized, deduplicated
Gold: Business-ready curated tables for specific use cases
For BI use cases, dimensional modeling with star schemas works well. An e-commerce business might have fact_orders and dim_customers tables that analysts can easily query.
Cost and performance considerations include:
Partitioning tables by date for faster queries
Clustering on frequently filtered columns
Setting retention policies to avoid ever-growing, unused tables
Monitoring storage costs as data volume grows
Data Consumption: Analytics, Products, and AI
Various teams consume pipeline outputs differently:
Analysts: BI tools like Looker, Mode, Power BI, and Tableau for data visualizations
Marketing: Reverse-ETL to push data back into Salesforce or HubSpot
Data scientists: Feature stores for ML models, experiment data
Product teams: Metrics dashboards, A/B test results
Operational use cases powered by reliable data pipelines include:
Near real-time fraud scoring on transactions
Dynamic pricing based on demand signals
Personalized recommendations for e-commerce
LLM-based copilots requiring fresh context data
This consumption layer should focus on usability and reliability. That means consistent metrics definitions, governed access control, and performance tuned for dashboards and APIs. Healthy consumption patterns, like self-serve analytics, reduce ad-hoc data engineer workload and make pipelines more valuable to the entire company.
Types of Data Pipelines: Batch, Streaming, and Hybrid
No single pipeline type fits all scenarios. High-performing teams often run a mix of batch and streaming workflows based on latency requirements and cost constraints.
Pipeline “type” refers to how and when data is processed, the time-based behavior, not which specific tools are used.
Batch pipelines process data on schedules (hourly, daily, weekly). They’re simpler, cheaper, and ideal when minutes or hours of latency are acceptable, common for reporting, finance, and analytics.
Streaming pipelines process events in real time with low latency. They power use cases like fraud detection, live dashboards, and personalization, but add complexity and cost.
Hybrid architectures combine both: batch for accuracy and history, streaming for speed. Teams often start with a batch and add streaming only when real-time needs justify it.
Data Pipelines vs. ETL, ELT, Warehouses, and Lakes
Terminology in the data space gets confusing. “Data pipeline” is the broad umbrella concept. ETL and ELT are specific methods for moving and transforming data. Warehouses and lakes are destinations where data lands.
Many teams and vendors use these terms loosely, which confuses planning and hiring decisions.
Concept | Purpose | Typical Tools | Primary Users |
Data Pipeline | End-to-end movement and transformation of data | Airflow, Dagster, custom code | Data engineers, ML engineers |
Extract → Transform → Load (transform before loading) | Informatica, Talend, legacy tools | Data engineers, IT teams | |
Extract → Load → Transform (load raw, transform in warehouse) | Fivetran + dbt, Airbyte + BigQuery | Analytics engineers, data engineers | |
Data Warehouse | Structured storage optimized for SQL analytics | Snowflake, BigQuery, Redshift | Analysts, BI teams |
Data Lake | Raw storage for all data types | S3 + Iceberg, Delta Lake, Azure Data Lake | Data scientists, ML engineers |
AI-driven organizations often use ELT combined with dbt and modern cloud data warehouses because it provides flexibility for exploratory analysis while leveraging scalable compute.
Key Stages of a Modern Data Pipeline
Understanding the key stages of a data pipeline, from ingestion to visualization, helps teams design systems that maintain data quality and enable data flows across the organization.
Strong observability (logging, metrics, alerts) should exist across all stages. Issues like late-arriving data, schema changes, or failing data processing jobs need to surface before they break dashboards or models.
The stages flow as: ingestion → validation and quality checks → transformation and modeling → storage → consumption (dashboards, ML models, APIs).
For regulated industries like fintech and healthcare, additional compliance and audit steps are embedded into these stages.
Ingestion & validation: Data flows in via APIs and connectors, with early checks (schema, nulls, ranges, timestamps) to catch issues fast. Tools like Great Expectations or data observability platforms help detect failures, volume anomalies, and schema changes.
Transformation & enrichment: Data is cleaned, joined, and enriched to create unified views, such as customer 360s, along with key metrics like retention, funnels, and revenue. Clear versioning and documentation provide metrics that are consistent and trusted.
Storage & visualization: Curated data is stored in analytics-ready schemas and exposed through SQL, BI tools, and dashboards. Semantic layers keep definitions consistent, enabling self-serve analysis for product, marketing, and leadership teams.
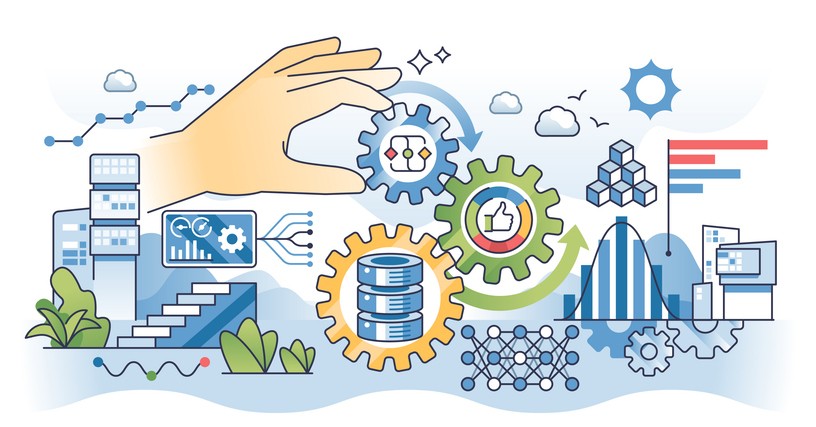
AI-Driven Automation in Data Pipelines
AI is no longer just a downstream consumer of data pipelines; it’s becoming part of how pipelines operate. Machine learning now automates routine tasks, improves reliability, and detects issues that would be hard for humans to catch.
While adoption accelerated between 2024 and 2026, AI doesn’t replace engineers. Experienced data and ML engineers are still essential to design architectures, set policies, and handle complex edge cases where human judgment matters.
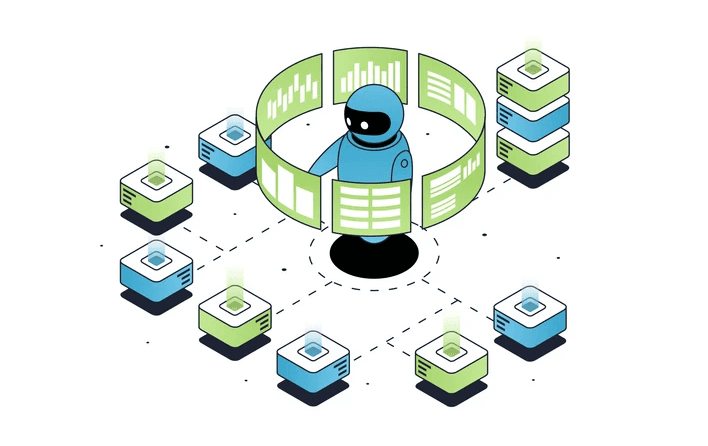
AI now automates key pipeline tasks, from data cleaning to monitoring. ML models detect outliers, duplicates, bad timestamps, and inconsistent formats, while language models infer column meaning and suggest validation rules. These tools enable auto-generated cleaning workflows like deduplication, address standardization, and missing-value imputation, though governance and human review remain essential, especially for high-risk data.
AI also speeds up transformations and schema mapping by drafting SQL/dbt models, identifying join keys, suggesting column mappings, and generating documentation. Engineers still review outputs, but productivity gains are significant.
Finally, AI-powered observability detects anomalies in data volume, freshness, and schemas, and can optimize orchestration by rescheduling jobs or autoscaling resources. These systems augment, not replace, experienced engineers, clear SLAs, and on-call processes.
Building a Data Pipeline: Steps, Roles, and Common Pitfalls
Building reliable data pipelines follows a practical approach: define goals, map sources, design a schema, choose tools, implement, and monitor continuously.
Typical roles involved:
Data engineer: Builds and maintains ingestion, processing, and orchestration
Analytics engineer: Models data in the warehouse, defines metrics
ML engineer: Creates feature pipelines for models, manages ML infrastructure
Data product manager: Prioritizes work, defines requirements, communicates with stakeholders
These responsibilities often overlap, especially at startups where one person might wear multiple hats.
From Requirements to Design
Start by aligning with stakeholders on what matters: required metrics, acceptable latency (real-time vs. batch), data retention, and compliance needs. Then translate those needs into design by defining core entities, documenting data sources, mapping the end-to-end flow, and flagging sensitive data. Clear SLAs are critical; specific expectations drive better architectural decisions.
Avoid common pitfalls early on, such as over-engineering real-time systems, ignoring security and governance, skipping source documentation, or assuming data sources will stay static.
Implementation, Testing, and Deployment
Build pipelines in stages: prototype with sample data, validate a minimal end-to-end flow, test on a small production slice, then scale to full volume. Ensure reliability with unit tests, data quality checks, metric comparisons, and load testing. Use CI/CD to deploy changes safely and reduce risk by running new pipelines in parallel with existing ones before fully switching over.
Monitoring, Governance, and Iteration
Effective pipelines require monitoring at multiple levels: jobs (failures, runtimes), data (freshness, volume, quality), and business metrics (unexpected KPI shifts). Strong access controls, role-based permissions, PII masking, and audit logs protect data integrity and compliance. Because requirements evolve, mature teams treat data pipelines as products, continuously improving them with clear SLOs and stakeholder feedback.
How Fonzi AI Helps You Build and Scale Data Pipelines
Tooling alone isn’t enough. Companies need experienced engineers and data leaders to architect, implement, and maintain cloud native data pipelines that actually deliver operational efficiency.
Fonzi AI is a curated talent marketplace that connects startups and enterprises with vetted AI, ML, data, and full-stack engineers through structured Match Day hiring events.
What makes Fonzi different:
Salary transparency: Companies commit to compensation upfront, eliminating negotiation games.
Pre-vetted technical skills: Candidates are evaluated for data engineering, ML infrastructure, and production experience, not just algorithm puzzles.
Fast hiring cycles: Most companies receive offers within approximately 3 weeks from the first interaction.
Bias-audited evaluations: Structured processes reduce unconscious bias in technical hiring.
Fonzi supports companies from their first data engineer hire (Series A startups) to enterprise-scale builds (thousands of engineers). The candidate experience is preserved and elevated, ensuring engaged, well-matched talent joins your team.
Think in terms of “pipeline teams,” not just “pipeline tools.” The engineers who design your data extraction strategy, maintain cloud data pipelines, and secure data accuracy are the foundation of your data platform.
Fonzi is the fastest way to assemble that team with high-signal, transparent hiring.
Summary
Modern data pipelines are the backbone of data-driven and AI-driven companies. They reliably move data from diverse sources through ingestion, validation, transformation, storage, and consumption, powering analytics, dashboards, and real-time AI use cases like fraud detection and recommendations. Unlike manual scripts, pipelines provide automation, scalability, monitoring, and governance.
A strong pipeline architecture connects sources (databases, SaaS tools, events) to warehouses or lakes using batch, streaming, or hybrid approaches, with tools like Kafka, Snowflake, BigQuery, and dbt. Design choices depend on latency, cost, and business needs, and successful teams invest in testing, CI/CD, observability, and clear SLAs.
AI is increasingly embedded into pipelines, automating data cleaning, schema mapping, anomaly detection, and orchestration, significantly reducing manual effort while still requiring human oversight for high-risk data. Ultimately, pipelines are not just tools but products that evolve with the business, requiring skilled data, analytics, and ML engineers to design, maintain, and scale them effectively.
FAQ
What is the difference between ETL and ELT in a modern data pipeline architecture?
How do data pipelines differ from data warehouses and data lakes?
What are the key stages of a data pipeline, from ingestion to visualization?
Which Python libraries are essential for building scalable data analysis pipelines?
How is AI being used to automate the cleaning and transformation of data within a pipeline?


