The shift to subscription-based software transformed how businesses measure success. Since around 2010, recurring revenue models have dominated SaaS, developer tools, and AI platforms, replacing one-time sales with predictable revenue that compounds over time and making annual recurring revenue the central measure of value.
Founders, CTOs, and AI team leads use ARR to plan product development, go-to-market expansion, and engineering hires, as it anchors conversations with investors, boards, and potential acquirers.
For AI-first companies, building infrastructure, training models, and hiring ML engineers requires significant capital, and knowing ARR helps guide those investments.
Key Takeaways
ARR (Annual Recurring Revenue) represents the normalized yearly value of all contracted subscription revenue and is calculated as Total Contract Value divided by Contract Term in Years for term-based contracts or MRR times 12 for monthly subscriptions.
Tracking ARR components such as New, Expansion, Contraction, and Churn helps leadership see where growth comes from and where revenue is leaking.
ARR guides headcount planning and product investment, and Fonzi helps teams hire elite AI engineers within about three weeks, aligning capacity with revenue forecasts from startups to large enterprises.
What Is ARR? Clear Definition and Business Context
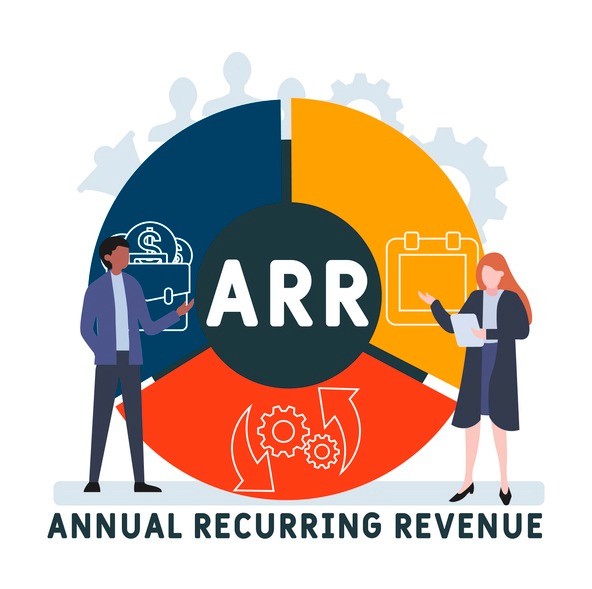
Annual Recurring Revenue (ARR) is the normalized annual value of contracted, recurring revenue from subscriptions. It represents the predictable income a subscription business expects to generate over a 12-month period from its active customer subscriptions and contracts. This metric focuses exclusively on recurring components while excluding one-time fees, usage-based overages, or non-recurring charges.
ARR is most accurate and useful for term-based contracts of 12 months or longer, which are common in B2B SaaS, developer platforms, and enterprise AI tools. When a company signs a multi-year deal, ARR annualizes that contract value to provide a stable view of yearly revenue predictability, smoothing out the irregularities that would otherwise distort financial planning.
It is worth noting that ARR can mean two things in the market. Annual Recurring Revenue refers to the annualized value based on actual contracts, while Annual Run Rate multiplies current monthly recurring revenue by 12 to project forward. Both approaches are valid, but understanding which definition your team and investors use is critical for alignment.
For example, if your AI platform closes a $120,000 three-year deal in 2024, your ARR from that contract is $40,000 per year, not the full contract value.
ARR excludes usage-based overages, implementation fees, and one-time services unless they are contractually recurring and predictable. This focus on pure subscription revenue highlights the engine of your business, the recurring income that repeats into the future.
ARR Formula: How to Calculate Annual Recurring Revenue
Accurate ARR depends on consistently including only recurring, contracted revenue. The key is establishing clear rules about what counts and sticking to them across finance, sales, and RevOps.
The core formula for contract-based ARR:
ARR = (Total Contract Value ÷ Contract Term in Years)
Sum this calculation across all active contracts to get your total ARR.
The run-rate-style formula for monthly subscriptions:
ARR = MRR × 12
This approach works well when most revenue comes from monthly subscriptions rather than annual contracts. Many subscription-based businesses and AI infrastructure tools use this method because their customer base pays monthly.
What to include in ARR:
Base subscription fees
Seat licenses
Committed add-ons with recurring pricing
What to exclude from ARR:
Setup and implementation fees
Training and professional services
Purely usage-based components (unless contracted minimums exist)
Here’s a simple example: A startup with 20 customers each paying $1,000 per month has $20,000 in monthly recurring revenue (MRR). Using the formula ARR = MRR × 12, that company has $240,000 ARR. This gives founders a clear projection of future revenue that informs hiring, runway, and fundraising conversations.
Components of ARR: New, Expansion, Contraction, and Churn
Understanding where your ARR comes from requires breaking it into four components:
New ARR: Revenue from brand-new customers who weren’t paying you before. This reflects your customer acquisition engine at work, bringing in new customers to your subscription model.
Expansion ARR: Additional revenue from existing customers through upsells, seat growth, or tier upgrades. This is your expansion revenue, reflecting how well you’re growing revenue within your current customer base.
Contraction ARR: Revenue lost when existing customers downgrade their plans or reduce seats. This doesn’t mean they’ve left, but they’re paying less than before.
Churned ARR: Revenue lost from customers who cancel entirely. This is the revenue lost when a customer relationship ends.
Net New ARR Formula:
Net New ARR = New ARR + Expansion ARR – Contraction ARR – Churned ARR
Let’s say in Q1 2026, your company adds $50,000 in New ARR, $20,000 in Expansion ARR, loses $5,000 to Contraction, and $10,000 to Churn. Your Net New ARR for the quarter is $55,000.
Tracking these components month-by-month or quarter-by-quarter helps leadership understand where growth really comes from. Is your growth driven by new customers or expansion from existing customers? Are you losing more to churn than you’re gaining from upsells?
Even simple spreadsheets can track these ARR movements early on. As you scale, these labels become essential for board and investor reporting.
Worked Examples of ARR Calculations
Scenario 1: Annual Contract
A customer signs a 12-month contract for $36,000, starting January 1, 2026.
Total Contract Value: $36,000
Contract Term: 1 year
ARR = $36,000 ÷ 1 = $36,000
Scenario 2: Multi-Year Enterprise Contract
An enterprise customer signs a 2-year contract worth $200,000, starting July 1, 2024.
Total Contract Value: $200,000
Contract Term: 2 years
ARR = $200,000 ÷ 2 = $100,000
Scenario 3: Monthly SaaS Using ARR = MRR × 12
A developer tools company has 150 customers paying an average of $500 per month.
MRR = 150 × $500 = $75,000
ARR = $75,000 × 12 = $900,000
Scenario 4: Mid-Contract Upgrade
A customer starts 2024 with 50 AI platform seats at $100/seat/month ($5,000 MRR). In July, they upgrade to 100 seats ($10,000 MRR).
Original ARR contribution: $60,000
New ARR contribution (post-upgrade): $120,000
Expansion ARR added: $60,000
Common mistakes to avoid:
Double-counting expansion ARR when a customer both upgrades and renews
Treating one-time implementation revenue as recurring ARR
Annualizing a peak month’s MRR instead of using a normalized average
Consistent definitions and formulas across finance, sales, and RevOps matter more than which exact variant you use. Pick an approach and stick with it.
ARR vs MRR, Revenue, and Profit: Key Differences
Leaders often confuse ARR, MRR, total revenue, and profit, and the confusion can derail planning and fundraising conversations. Each metric serves a different purpose, and clarity matters.
Monthly Recurring Revenue (MRR) measures normalized recurring revenue per month. It is calculated by summing all monthly subscription fees across active customers. MRR is better for shorter contracts and detailed operational monitoring, helping you spot month-over-month trends, seasonal patterns, or immediate issues with revenue growth.
Total Revenue (GAAP) includes all income, both recurring and non-recurring. This is the accounting figure that appears on income statements and includes one-time fees, professional services, and any other revenue generated during a period.
Profit is revenue minus all costs, including cost of goods sold, R&D, sales, and general administrative expenses. Net profit tells you whether you are making money, while ARR tells you whether you have a sustainable subscription revenue engine.
The key distinction is that ARR is a forward-looking, normalized metric for recurring revenue, while GAAP revenue is a backward-looking, recognized accounting figure. For a company’s financial health, you need both perspectives.
Profitable growth means balancing ARR growth with margins and cash burn. Capital-efficient AI companies in particular must watch this balance closely, since compute costs and engineering salaries can consume significant resources.
Comparison Table: ARR vs MRR vs Revenue vs Profit
Here’s a side-by-side comparison to clarify how these metrics differ and when to use each:
Metric | What It Measures | Typical Use Case | Includes One-Time Fees? | Time Horizon | Who Cares Most |
ARR | Annualized value of recurring subscriptions | Valuations, fundraising, annual planning, headcount forecasting | No | Annual | Founders, investors, board members |
MRR | Monthly value of recurring subscriptions | Operational tracking, churn analysis, monthly sales performance | No | Monthly | RevOps, sales leaders, finance teams |
Total Revenue (GAAP) | All recognized income in a period | Financial statements, tax reporting, compliance | Yes | Varies | CFOs, accountants, auditors |
Gross Profit | Revenue minus cost of goods sold | Unit economics, pricing decisions, margin analysis | Yes | Varies | Finance, product, operations |
Net Profit | Revenue minus all operating costs | Long-term sustainability, profitability milestones | Yes | Varies | Founders, investors, leadership |
Founders and AI leaders should use ARR for growth and headcount planning, MRR for operational monitoring, and profit metrics for long-term sustainability decisions.
Why ARR Is So Important for SaaS and AI Startups
ARR became the de facto language of value for SaaS and AI subscription businesses starting around 2012. It is the metric that investors, acquirers, and board members use to benchmark companies and the one that founders use to set milestones and measure progress.
Investors typically benchmark companies by ARR milestones:
$1M ARR: Often the threshold for Seed or Series A conversations
$5M–$10M ARR: Typically signals readiness for Series B
$20M+ ARR: Later-stage territory where growth efficiency becomes paramount
ARR underpins financial forecasting, including revenue projections, runway modeling, and decisions about expanding sales, marketing, and AI teams. When you know your ARR and its growth trajectory, you can forecast future revenue with confidence and make informed bets on resource allocation.
For AI infrastructure, developer tools, and applied AI platforms, longer contracts of 12 to 36 months are common. This makes ARR particularly accurate and investor-friendly, since the revenue stream is locked in for extended periods. Strong ARR and low churn give leaders confidence to invest in long-term bets such as data infrastructure, AI research, and high-caliber engineering hires.
ARR is more than a vanity metric; it is a key indicator of business health that drives real decisions about a company’s growth.
ARR Growth Rates: What “Good” Looks Like by Stage
What constitutes a good ARR growth rate depends on your stage, funding model, and market context.
Stage-specific benchmarks:
Sub-$1M ARR: Early-stage companies often aim for 2–3× year-over-year growth. At this stage, you’re proving product-market fit and building initial market demand.
$1M–$10M ARR: Target 50–100% year-over-year growth. This is the scaling phase where you’re expanding your customer acquisition and go-to-market motions.
$10M+ ARR: Growth typically normalizes to 30–50% annually. At scale, maintaining high percentage growth becomes mathematically harder, and investors shift focus to efficiency metrics.
Capital-efficient bootstrapped companies often grow more steadily, while VC-backed companies may prioritize faster, riskier scaling. Neither approach is inherently better, and the right strategy depends on your goals and resources.
For AI startups with high marginal costs for compute, ARR growth must be weighed against unit economics. Customer lifetime value to customer acquisition cost (LTV:CAC) should target 3:1, and CAC payback should ideally be under 15 months. The Rule of 40, where ARR growth rate plus profit margin equals or exceeds 40 percent, serves as an investor litmus test for balanced expansion.
Track both absolute ARR dollars added per year and growth percentage. As your base grows larger, percentage growth becomes harder to maintain even as absolute dollar growth accelerates.
Limitations of ARR as a Standalone Metric
ARR is essential, but it doesn’t tell the whole story. Relying on it in isolation can mask serious problems.
What ARR doesn’t capture:
Customer health and satisfaction signals
Retention quality beyond simple churn numbers
The cost of acquiring that revenue (customer acquisition cost)
Usage patterns within contracts
ARR must be paired with net revenue retention (NRR), logo churn, gross margin, and CAC payback to give a complete picture. Net revenue retention in particular matters enormously. Healthy SaaS firms target NRR above 100 percent, ideally 110 to 120 percent, meaning revenue from existing customers grows even after accounting for churn and contraction.
Consider this scenario. Your ARR is growing at 40 percent year-over-year, but your net revenue retention is sliding toward 90 percent. That means you are losing revenue from existing customers faster than you are expanding within your base. Eventually, this will catch up with you, as new customer acquisition can only offset so much churn.
For usage-based AI products, consumption can be volatile even when ARR looks healthy. Leaders should monitor usage trends and cohort behavior alongside contract values.
Smart operators interpret ARR in context. It is a key metric, not the only metric.
ARR, Talent, and Scaling AI Teams: Where Fonzi Fits In

Predictable ARR creates the foundation for planning engineering and AI headcount. When you cross major milestones of $1M, $5M, or $10M ARR, you gain the confidence to invest in long-term customer relationships and the product velocity that sustains them. That investment often means hiring elite AI engineers.
Fonzi is a specialized hiring platform that matches companies with elite AI and ML engineers using a rigorous, standardized technical evaluation pipeline. Unlike traditional recruiting, Fonzi focuses exclusively on AI talent and applies consistent quality standards across every search.
What makes Fonzi different:
Speed: Typical time-to-hire is approximately 3 weeks, dramatically faster than industry averages
Consistency: The same rigorous process applies whether you’re making your first AI hire or your 10,000th
Candidate experience: Transparent communication, relevant problem sets, and respectful interview loops ensure engaged, well-matched talent
How Fonzi Works for ARR-Driven Teams
Fonzi’s process is designed for scalable growth:
Requirements intake: Define the stack, role, and seniority level. Whether you need ML infrastructure specialists, research engineers, or applied ML practitioners, the process starts with understanding your specific needs.
Search and vetting: Fonzi sources candidates from its network and applies initial filters for technical capability and cultural fit.
Technical evaluation: Standardized AI/ML challenges, code reviews, and system design for ML infrastructure. Problems are aligned with real-world workloads, not abstract puzzles.
Shortlisting: Only candidates who pass rigorous evaluation reach your team, reducing time spent on unqualified applicants.
Final interviews: Your team conducts focused interviews with pre-vetted candidates, making confident hiring decisions faster.
Fonzi supports both early-stage AI startups, Seed through Series A with ARR under $5M, and large enterprises scaling to hundreds or thousands of AI hires. The same process works at any scale, which matters as your company’s valuation grows.
Benefits for ARR-focused leaders:
Reduced mis-hire risk protects your investment in engineering
Less time spent evaluating unqualified candidates
Repeatable process that scales with ARR growth
Preserved candidate experience that reflects well on your employer brand
ARR Best Practices: Reporting, Tooling, and Avoiding Pitfalls
Clean, consistent ARR reporting becomes critical once a company passes a few hundred thousand in ARR or a few dozen customers. At that point, ad-hoc tracking breaks down and errors start compounding.
Establish a clear ARR policy document that defines:
What counts as ARR (and what doesn’t)
How upgrades and downgrades are handled mid-contract
When churn is recorded (contract end date vs. cancellation date)
How multi-year contracts are annualized
Early-stage companies can start with a spreadsheet-based transaction ledger tracking new, renewal, expansion, contraction, and churn events by date. This simple approach works well through $1M to $2M ARR.
As ARR and customer count scale, specialized tools become necessary. Billing platforms like Stripe, Chargebee, or Zuora integrate with subscription analytics tools to automate ARR calculations and ensure auditability.
Common pitfalls to avoid:
Backfilling ARR to look better for investors (this destroys trust when discovered)
Annualizing peak months unrealistically (use normalized averages)
Mixing ARR with GAAP revenue in board decks (keep them clearly separated)
Changing definitions mid-stream without documenting the change
ARR Reporting Cadence and Stakeholder Communication
A practical reporting cadence keeps everyone aligned without creating excessive overhead:
Monthly: MRR reporting with month-over-month trends
Quarterly: ARR roll-forwards showing New/Expansion/Contraction/Churn waterfall
Annually: Deep dives with year-over-year comparisons and cohort analysis
Different stakeholders use ARR differently. Founders and CFOs use it for funding and runway planning. CTOs and AI leaders use it for headcount and infrastructure planning. Boards use it for governance and milestone tracking.
Recommended visuals:
Line charts showing ARR over time (simple and clear)
Waterfall charts showing ARR component movements each quarter
Cohort retention curves showing how ARR from different signup periods behaves
In recurring stakeholder updates, include ARR plus 3–4 supporting metrics:
Net revenue retention
Gross margin
CAC payback
Pipeline coverage
Transparent, conservative ARR reporting builds long-term trust with investors, employees, and candidates, including senior AI talent evaluating your offers.
Conclusion
Annual recurring revenue is the key metric for subscription and AI-driven businesses. It guides funding rounds, headcount planning, and product investment decisions.
Precise calculation matters. Clear formulas, consistent rules, and aligned definitions across teams prevent confusion and build credibility with investors and boards. ARR alone is not enough. Consider it alongside growth rate, churn, margins, and capital efficiency to understand whether growth is sustainable and customer relationships are strong.
As ARR grows, so does your ability to invest in elite AI talent. Fonzi makes hiring predictable, filling top AI engineer roles within about three weeks through a scalable process that works from your first hire to your 10,000th. Use ARR milestones to trigger hiring plan reviews. Crossing $1M, $5M, or $10M ARR is the right time to engage Fonzi and ensure engineering capacity keeps pace with growth.
FAQ
What does ARR stand for and what does it mean in business?
How do you calculate ARR and what’s the formula?
What’s the difference between ARR and MRR?
Why is ARR important for SaaS companies and startups?
What is considered a good ARR growth rate for a startup?