How to Create High-Velocity Org Charts for AI-Native Teams
By
Ethan Fahey
•

Since the post-2023 AI boom, the way tech companies build teams has changed almost overnight. Rapid growth in LLM development, ML infrastructure, and data platforms made static org charts, those dusty Google Docs or spreadsheets, basically useless. Teams now reorganize quarterly or even monthly as priorities shift. For talent leaders and hiring managers between 2024 and 2026, the same issues keep popping up: fuzzy ownership between research and product, overlapping AI initiatives wasting time and budget, and slow alignment across distributed teams. If leadership can’t quickly answer who owns core systems like inference or where open headcount actually sits, hiring slows, and competitors pull ahead.
That’s why high-velocity org charts matter. These are living, data-connected maps that show not just reporting lines, but real ownership, collaboration, and system responsibility updated in real time as teams evolve. At Fonzi AI, we see a direct link between clear org design and faster hiring outcomes. Companies that come into Match Day with defined pods, priorities, and open roles move dramatically faster because decisions are already aligned. Fonzi’s platform layers structured evaluation, fraud checks, and recruiter coordination on top of that clarity, helping teams fill critical AI and engineering roles in days instead of months. In today’s AI market, org clarity isn’t just internal hygiene; it’s a hiring advantage.
Key Takeaways
AI-native org charts help fast-growing tech companies shorten hiring cycles, clarify ownership across AI, product, and engineering, and plan headcount with real-time data synced to HRIS systems.
Fonzi AI is a curated talent marketplace that helps fill AI/ML and engineering roles appearing in these org charts, often within a 48-hour Match Day hiring event.
Modern organizational charts must represent cross-functional pods, dotted-line reporting, and digital workers (AI agents) alongside humans, not just traditional hierarchies.
Integrating org charts with HRIS/ATS and AI tools enables dynamic updates, scenario planning, and bias-audited hiring decisions that reduce time-to-offer by up to 50%.
Understanding Modern Org Charts for AI-Native Companies
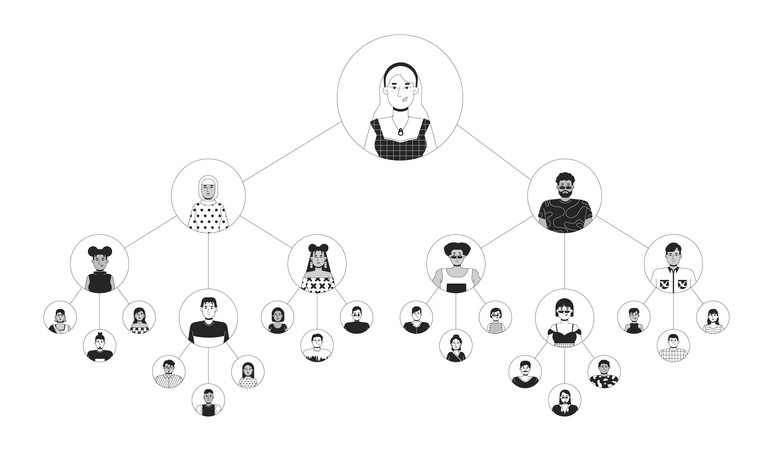
An org chart, at its core, is a diagram illustrating the internal structure of a company, including its hierarchies, reporting relationships, roles, and connections among employees or teams. Historically, these charts trace back to the early 20th century, with Daniel McCallum’s 1855 railroad company diagram marking one of the first known examples. But what worked for industrial-era corporations bears little resemblance to what AI-native companies need today.
AI-native companies differ from traditional enterprises in fundamental ways. They operate with smaller, more specialized teams that need to iterate rapidly. They blend research and product development in ways that don’t fit neatly into different departments. And increasingly, they employ not just humans but automated AI agents that handle tasks like candidate screening, code review, and customer support.
A 2026-ready org chart for an AI-native company must account for core entities that simply didn’t exist a decade ago:
AI Research – Teams focused on foundational model development and experimentation
Applied ML – Engineers translating research into production-ready features
Data Platform – Infrastructure teams managing training data, pipelines, and storage
Product Engineering – Full-stack and frontend engineers building user-facing applications
ML Ops/DevOps – Specialists ensuring models deploy reliably and scale efficiently
GTM Pods – Go-to-market teams increasingly integrated with technical functions
Modern organizational charts must depict three dimensions simultaneously: reporting lines (who approves your promotion), cross functional collaboration within pod membership (who you ship features with), and ownership of AI systems or models (who’s accountable when the recommendation engine breaks).
Here’s what this looks like in practice for a 60-person AI startup:
CEO
├── VP Engineering
│ ├── Head of ML Infrastructure
│ │ └── ML Infra Team (4 engineers)
│ ├── Head of Applied ML
│ │ └── Applied ML Team (6 engineers)
│ └── Head of Product Engineering
│ └── Product Eng Team (8 engineers)
├── VP Product
│ └── Product Managers (3)
└── VP Operations
└── RevOps, People, Finance
But this hierarchical view only tells part of the story. Alongside it, you’d maintain a pod view showing that two ML Infra engineers, one Applied ML engineer, and one Product Manager form the “Search & Discovery Pod” with dotted line reporting to a pod lead.
One critical evolution: org charts for AI-native teams should show both human roles and automated AI agents as distinct but related nodes. If your company uses an AI screening agent that processes 500 candidate evaluations daily, that system belongs on your chart linked to the team accountable for its performance.
Choosing the Right Org Chart Structure for Scaling AI Startups
The right structure for your organizational chart depends heavily on your stage. A pre-Series A startup with under 20 people operates fundamentally differently than a post-Series B company with 100 employees, and both differ from a growth-stage organization pushing past 500.
Three core architectures matter most for AI-native teams:
Hierarchical organizational chart: The classic pyramid with CEO at the top cascading to middle managers and entry level employees. Clear chain of command, easy to understand, works well for companies where decisions flow top down. The downside? Can slow decision-making in environments requiring rapid iteration.
Flat org chart: Minimal management layers, with the CEO overseeing autonomous pods or individuals directly. Promotes speed and ownership. Works brilliantly for small businesses and early-stage startups but becomes chaotic past 100 employees when coordination overhead explodes.
Matrix organizational chart: Dual reporting lines blending functional (engineering, product) and project or pod-based chains. Enables cross functional collaboration and resource sharing but risks confusion from conflicting priorities if not managed carefully.
Research from McKinsey’s 2025 agility report found that 68% of high-growth tech firms using hybrid matrix-flat structures achieve 2.5x faster hiring-to-product timelines compared to traditional hierarchies. The key is matching structure to your company’s needs at each stage.
Comparing Org Structures for AI-Native Teams
Structure Type | Best For | Typical Team Size | Pros | Risks / Tradeoffs | Example Use Case (2024–2026) |
Hierarchical | Companies needing clear accountability and established processes | 100–500+ | Clear chain of command; easy scalability; well-understood by investors and boards | Can stifle agility; slower decisions; may create silos between different departments | 200-person enterprise AI company with compliance requirements and multiple product lines |
Flat/Pod-Based | Early-stage startups prioritizing speed and ownership | 10–80 | Fast decisions; high autonomy; easy access to leadership; promotes open communication | Blurred accountability at scale; coordination challenges past 100 heads; relies on generalists | 35-person LLM tools startup with three autonomous cross-functional pods |
Matrix | Companies needing both functional depth and cross-functional speed | 60–300+ | Enables specialization AND collaboration; flexible resource allocation; supports multiple products | Dual reporting can cause confusion; requires mature management; higher coordination overhead | 120-person AI SaaS company with dedicated pods for enterprise, SMB, and platform products |
The matrix and pod-based structures most easily accommodate cross-functional AI pods and dotted-line reporting. They’re also the structures where HRIS-syncing org chart tools provide the most value, since relationships change frequently and manual updates become unsustainable.
When choosing structure, optimize for the decisions you make most frequently. If you’re constantly shipping AI features, pod-based wins. If you’re coordinating large-scale infrastructure investments, hierarchy provides needed control.
Examples of Flat vs Matrix Org Charts for Remote Tech Teams
Flat org chart example: 25-person remote AI startup
This early-stage company builds AI-powered developer tools. The organizational structure is intentionally minimal:
CEO
├── VP Engineering
│ ├── Pod: Core Platform (5 engineers + 1 designer)
│ ├── Pod: AI Features (4 ML engineers + 1 PM)
│ └── Pod: Growth (3 engineers + 1 PM + 1 designer)
└── Head of Operations (Finance, People, Legal)
Every engineer has a single solid line to the VP Engineering. Pods self-organize around missions like “improve code completion latency” or “launch enterprise tier.” Decisions happen in Slack within hours. The chart fits on a single page and everyone stays on the same page about who’s doing what.
The trade-off? This structure relies heavily on generalist AI engineers who can context-switch across problems. Fonzi AI often helps these companies hire versatile full-stack ML engineers comfortable wearing multiple hats.
Matrix org chart example: 120-person remote-first AI company
This Series C company sells AI infrastructure to enterprises across multiple verticals. The complexity demands a matrix approach:
CEO
├── CTO
│ ├── Head of ML Platform (12 engineers, solid line)
│ ├── Head of Data Engineering (10 engineers, solid line)
│ └── Head of Product Engineering (25 engineers, solid line)
├── VP Product
│ ├── Enterprise Pod Lead (dotted line to 8 engineers from various teams)
│ ├── SMB Pod Lead (dotted line to 6 engineers from various teams)
│ └── Platform Pod Lead (dotted line to 10 engineers from various teams)
└── VP GTM
Engineers report with a solid line to their functional lead (Head of ML Platform) but have a dotted line connection to their product pod lead. A Senior ML Engineer might report to the Head of ML Platform for career growth, performance reviews, and technical standards, while coordinating daily with the Enterprise Pod Lead on feature delivery.
GitLab’s 1,400+ remote workforce uses a similar model. Studies show this approach boosts collaboration by 45% via shared resources, though it requires robust coordination tools and clear communication about which lead handles which decisions.
The matrix structure demands specialized talent: dedicated ML infrastructure engineers, data platform specialists, and product-focused engineers. This is where Fonzi AI’s curated marketplace proves valuable, connecting companies with pre-vetted candidates whose skills match specific functional and pod needs.
Designing High-Velocity Org Charts: From Whiteboard to Data-Driven Map

Creating org charts that drive velocity rather than just documenting hierarchy requires a structured approach. Here’s a step-by-step process that works for AI-native teams:
Step 1: Define missions, not titles
Start with the outcomes your company needs to achieve. “Ship reliable LLM inference platform” is a mission. “Reduce customer churn by 25%” is a mission. “Staff ML Engineer” is just a title. List your top 5–7 missions for the next 12 months before drawing a single box on your chart.
Step 2: Map required capabilities
For each mission, identify the capabilities needed. The LLM platform mission might require: distributed systems expertise, GPU optimization, model serving, observability, and security. Write these down as they’ll inform role definitions later.
Step 3: Assign ownership
Every mission needs a single accountable owner. This person might not do all the work, but they’re responsible for the outcome. Document these ownership relationships; they’ll form the backbone of your organizational structure.
Step 4: Map people to roles
Now start placing individuals on the chart. Match people to the capabilities and missions they’ll own. Identify gaps where you need to hire. Mark open positions clearly with target fill dates.
Step 5: Add pod and project views
Create a secondary view showing cross-functional pods. One ML engineer might appear in the “ML Platform” functional team with a solid line to their manager, while also appearing in the “Enterprise AI Pod” with a dotted line to the pod lead.
Step 6: Represent AI agents and digital workers
If your company uses automated systems such as screening agents, support bots, or code review tools, add them as nodes. Use distinct icons (robot symbols work well) and link each to the human team accountable for its performance.
Design principles for high-velocity charts:
Keep top-level layers to 1–2 max; simplify what the CEO and leadership team see
Limit lateral complexity on any single view; create linked views for “AI Platform,” “Product Pods,” and “GTM” rather than cramming everything together
Use consistent iconography across views so a dotted line means the same thing everywhere
Include metadata: role status (filled/open/planned), target hire date, required skills
Accounting for Cross-Functional Pods and Dotted-Line Reporting
The question of when to use dotted-line reporting comes up constantly. Here’s a practical framework:
Use dotted lines when:
An individual contributes significantly to a team they don’t formally report to
Cross-functional pods need daily collaboration but functional teams own career development
Specialists (AI safety, security, data privacy) support multiple product teams
Keep it simple with solid lines when:
You’re under 50 employees and coordination overhead is low
Roles are truly dedicated to a single mission or product
You want absolute clarity on who approves time off and performance reviews
Visually, use distinct line styles: solid lines for primary reporting relationships, dashed lines for secondary pod or project connections. Most professionally designed org chart tools support this natively. The key is consistency; if a dashed line means “pod collaboration” in one chart, it should mean the same thing everywhere.
For remote and hybrid teams, consider maintaining two linked views:
Hierarchy view: Official reporting structure, used for HR processes, approvals, and the company’s hierarchy documentation
Pod view: Day-to-day collaboration structure, showing who works together on what
At Fonzi AI, we often help clients hire anchor roles for new pods, like a founding ML engineer for a growth pod or a senior data engineer for a new platform team. These roles should appear clearly in both views, with their ownership scope documented so everyone understands the responsibilities attached to the position.
Connecting Org Charts to Your Hiring Strategy
A modern org chart isn’t just a diagram; it’s a headcount plan in visual form. Each box can be labeled as “filled,” “open now,” or “planned Q3 2025.” This transforms your chart from a static document into a dynamic hiring roadmap.
Here’s how to connect your chart to hiring strategy:
Label every role with status and timeline:
Filled: Name of current holder
Open: Target fill date, priority level (P0/P1/P2)
Planned: Expected opening date, budget approval status
Tie roles to missions:
Instead of generic job titles, annotate roles with their mission context: “Senior ML Engineer – LLM Observability Platform – Q3 2025 hire.” This creates clarity for your talent team and external partners like Fonzi AI who need to understand the context of each role.
Use the chart to prioritize:
Ask yourself:
Where are single points of failure? (One engineer owning critical ML infrastructure)
Where are skill gaps? (No one with retrieval-augmented generation experience)
Who’s overextended? (Tech leads managing 12+ direct reports)
These patterns reveal your highest-priority hires.
Annotate with skill requirements:
Add metadata to open roles listing required skill clusters. For an ML Platform Lead, you might note: “distributed systems, Kubernetes, model serving, Python, 5+ years experience.” This aligns directly with the vetted candidate metadata in platforms like Fonzi’s marketplace, making matching faster and more accurate.
Imagine a VP of Engineering reviewing their org chart before a board meeting. They spot that the LLM Platform pod has one Staff Engineer supporting three mission-critical systems with no backup. That gap becomes the P0 hire for next quarter, with a clear timeline and skill requirements already documented.
How Fonzi AI Fits into Your Org Chart Planning
Fonzi AI’s Match Day model delivers the fastest results when companies arrive with a clear org chart and shortlist of high-priority roles. Here’s how the integration works:
Before Match Day:
Your team shares your current org chart with Fonzi’s concierge recruiters. We help translate high-level needs (“we need more AI people”) into specific roles: Senior Applied ML Engineer, Data Platform Engineer, Full-Stack Engineer for AI tooling. Each role gets defined skill requirements and salary bands.
During Match Day:
Our multi-agent AI pre-screens candidates, runs fraud detection (flagging up to 15% of fake profiles), and standardizes evaluations with bias-audited scoring rubrics. Human recruiters focus on culture fit, mission alignment, and compensation discussions. Companies commit to a salary upfront without the back-and-forth that drags out timelines.
After Match Day:
Offers typically go out within a 48-hour window. New hires slot directly into your org chart, with their pod assignments, reporting lines, and responsibilities already defined.
The companies that benefit most from this model have done the organizational structure work ahead of time. They know which pods need reinforcement, which missions lack owners, and what seniority levels fill their gaps. The org chart isn’t paperwork; it’s the strategic foundation that makes rapid hiring possible.
Bringing AI into the Org Design and Hiring Stack (Without Losing Control)
The idea of using AI in hiring can feel uncomfortable. Will algorithms replace human judgment? Will bias creep into automated systems? The answer depends entirely on implementation.
The best approach positions AI as an assistant that handles high-volume, repeatable tasks while humans retain final decision-making power. Here are the challenges AI solves:
Recruiter bandwidth: Top recruiters at fast-growing companies juggle 200+ requisitions quarterly. They can’t give every resume the attention it deserves. AI screening agents can process 1,000 resumes per hour at 95% accuracy, surfacing the top 10% for human review.
Inconsistent interview feedback: Different interviewers evaluate candidates differently. AI-powered structured evaluation rubrics ensure every candidate gets scored on the same criteria, making comparison meaningful.
Manual resume review: Reading 500 resumes for a single AI engineer role takes days. AI parses resumes instantly, extracting relevant experience, skills, and red flags.
Fraud detection: Fake credentials, fabricated GitHub contributions, and misrepresented experience plague AI hiring. Fonzi’s fraud detection agents flag suspicious profiles before they waste interview slots, reducing bad hires by up to 28%.
How to implement AI without losing control:
Start with screening: Use AI to filter obviously unqualified candidates, but have humans review anyone in the “maybe” zone
Standardize evaluations: Implement AI-assisted scoring rubrics that interviewers fill in together
Track outcomes: Measure whether AI-assisted hires perform better, worse, or the same as traditional hires
Expand gradually: Once you trust screening results, use AI insights to adjust org charts and role definitions over time
The key insight? You’re not choosing between AI and human judgment. You’re using AI to give humans better data so they can make better decisions faster.
Bias-Audited Evaluation and Fair Org Design
Org charts can unintentionally encode bias. Maybe all “research” roles cluster in one geography. Maybe senior positions skew toward one demographic. Maybe certain teams consistently get more resources while others are overlooked. These patterns emerge gradually and become entrenched without intentional review.
AI can help analyze current org charts for representation across multiple dimensions while respecting privacy and local laws. The data reveals patterns that human reviewers might miss: Are certain backgrounds concentrated in specific functions? Are promotion rates equitable across teams? Does attrition spike for particular groups?
At Fonzi AI, our evaluation frameworks are bias-audited specifically to prevent shortlists from being skewed by inconsistent reviewer preferences. Structured evaluation means every candidate gets assessed on the same criteria, regardless of who conducts the interview.
The practical implication: As you grow from 10 to 100+ employees, periodically re-evaluate both the structure of your organization and the composition of your teams. The org chart is the artifact that makes these patterns visible if you’re using data-connected tools that surface relevant analytics.
Building Dynamic, Integrated Org Charts with Your HR Stack

Static PowerPoint org charts become outdated almost immediately in high-growth AI startups. A single funding round can add 20 headcount in 90 days. A product launch might spin up an entirely new pod. Templates created in Excel or PDF files can’t keep pace.
The solution? Live org charts that sync directly with HRIS and ATS systems, updating nightly or in real-time when new hires join, transfers occur, or roles change.
Benefits of integrated, dynamic org charts:
Single source of truth: No more conflicting versions floating in email and shared drives
Easier onboarding: New hires immediately see where they fit, who their team is, and who to collaborate with
Faster role approval: Leadership can visualize gaps and approve new headcount with context
Real-time open roles: Everyone knows which positions are filled versus open, eliminating duplicate outreach
Modern AI-powered org chart builders go further. Workday’s Org Chart AI (rated 4.8/5 on G2 for 2026) auto-populates from HRIS like BambooHR or Rippling, using ML to predict role gaps based on hiring velocity. Changes sync in under 5 seconds. Lucidchart’s AI edition (4.9/5) excels at dynamic matrix rendering, pulling ADP data to forecast org evolution. Microsoft Visio with Copilot integration (4.7/5) generates charts from natural language and syncs with project management tools.
What to look for in org chart software:
Real-time HRIS sync (not just CSV file imports)
Support for multiple views: hierarchy, pod, geography, project
Granular permissions so sensitive salary and performance data stays protected
Ability to mark roles as filled, open, or planned with target dates
Analytics: span of control, attrition risk, team load
These features turn your org chart from a compliance document into a strategic tool that connects directly to your hiring strategy.
Representing Digital Workers and AI Agents on the Org Chart
Here’s a question most org chart guides ignore: How do you represent the AI agents and automated systems that are increasingly part of your workforce?
A 2026 B2B SaaS company might employ:
AI customer support assistants handling tier-1 tickets
Automated code review bots running on every pull request
Candidate screening agents processing hundreds of applications daily
Internal knowledge base chatbots answering employee questions
These digital workers consume resources, require oversight, and impact company operations. They belong on your org chart.
Best practices for representing AI agents:
Use distinct visual markers: Different shapes (hexagons, robot icons) or colors distinguish AI systems from human employees
Link to accountable owners: Every AI agent node connects to a human “Accountable Owner” who’s responsible for its performance, ethics, and reliability
Include key metrics: Note throughput (500 evaluations/day) or accuracy (95% match rate) where relevant
Show integration points: Dotted lines can indicate which teams the AI agent serves or collaborates with
Example structure for a customer support AI:
VP Customer Experience
├── Head of Customer Success (human)
│ └── Customer Success Team (8 humans)
├── Head of Support (human)
│ └── Support Team (6 humans)
└── AI Support Assistant [Digital Worker]
├── Owned by: Head of Support
└── Dotted line to: Platform Engineering (for maintenance)
This visibility matters. It clarifies who’s responsible when the AI makes a mistake. It makes capacity transparent; you can see both your human and digital workforce. And it normalizes the reality that modern teams include both.
Industry benchmarks suggest AI-native companies with 20–30% digital workers in their org charts boost hiring velocity by 4x, since AI handles repetitive tasks and humans focus on high-judgment decisions.
Conclusion
AI-native companies can’t afford to treat org charts as dusty compliance artifacts that get created once and ignored. The teams winning today’s talent war see their org structure as a living, strategic tool; one that actively guides hiring decisions, clarifies ownership, and supports the rapid iteration AI product development requires. High-velocity org charts help leaders quickly spot skill gaps, prioritize critical AI and engineering hires, and coordinate cross-functional pods across distributed teams. More importantly, they show how people actually work together, which AI systems need human oversight, and how responsibilities evolve as products scale. When connected to real-time HRIS data, these org charts become dynamic headcount planning engines instead of static diagrams.
This is where AI-driven org analysis really shines. Integrating AI into evaluation and planning speeds up hiring and improves fairness, without removing humans from the loop. Multi-agent systems can support screening, fraud detection, and standardized assessments, while final decisions stay firmly with your team, backed by better data. Fonzi AI helps companies turn their org charts into action by aligning structure with hiring execution. Bring your current or planned org chart to Fonzi AI, run a Match Day, and fill critical AI and engineering roles in days, not months. Whether you’re hiring an ML infrastructure lead or scaling applied ML teams, Fonzi helps you move faster, hire smarter, and keep human judgment where it matters most.
FAQ
What is the most effective org chart structure for a scaling AI startup in 2026?
How do I create an org chart that accounts for cross-functional pods and dotted-line reporting?
What are the top-rated AI-powered org chart builders that sync with HRIS data in real-time?
Can you provide examples of “Flat” vs “Matrix” org charts for remote technology companies?
How should automated AI agents or “Digital Workers” be represented on a modern company org chart?


